Thank you.
Your message is on its way to our team. We will be in touch soon.
Preview only: nothing was sent
Your plan is built on an assumed long-term rate of return, not on what the market does day to day or week to week.
On Thursday, November 19, the market dropped again. The S&P 500 fell 2.02% and the Nasdaq fell 2.25%, according to CNBC. It was the sixth straight losing day for the S&P 500, according to Investopedia.
That came two weeks after November 5, when the Nasdaq had its biggest one-day drop in 19 months, according to Reuters. Chip stocks fell that day on fears of tougher AI rules after the midterm elections. The next day, Reuters reported investors were uneasy ahead of new inflation data.
Through November 19, the S&P 500 was down 5.3% for November and the Nasdaq was down 6.1%.
If you checked your accounts this month and felt nervous, that's normal. If you didn't check at all, even better.
At Virtus, every financial plan rests on a few long-term numbers. Below I walk through what the market did this month, what US stocks have done over the past 50 years, and the numbers your plan runs on before and after retirement.
The chart below tracks both indexes from the last trading day of October through November 19. Each line shows the percent change from the October 30 close.
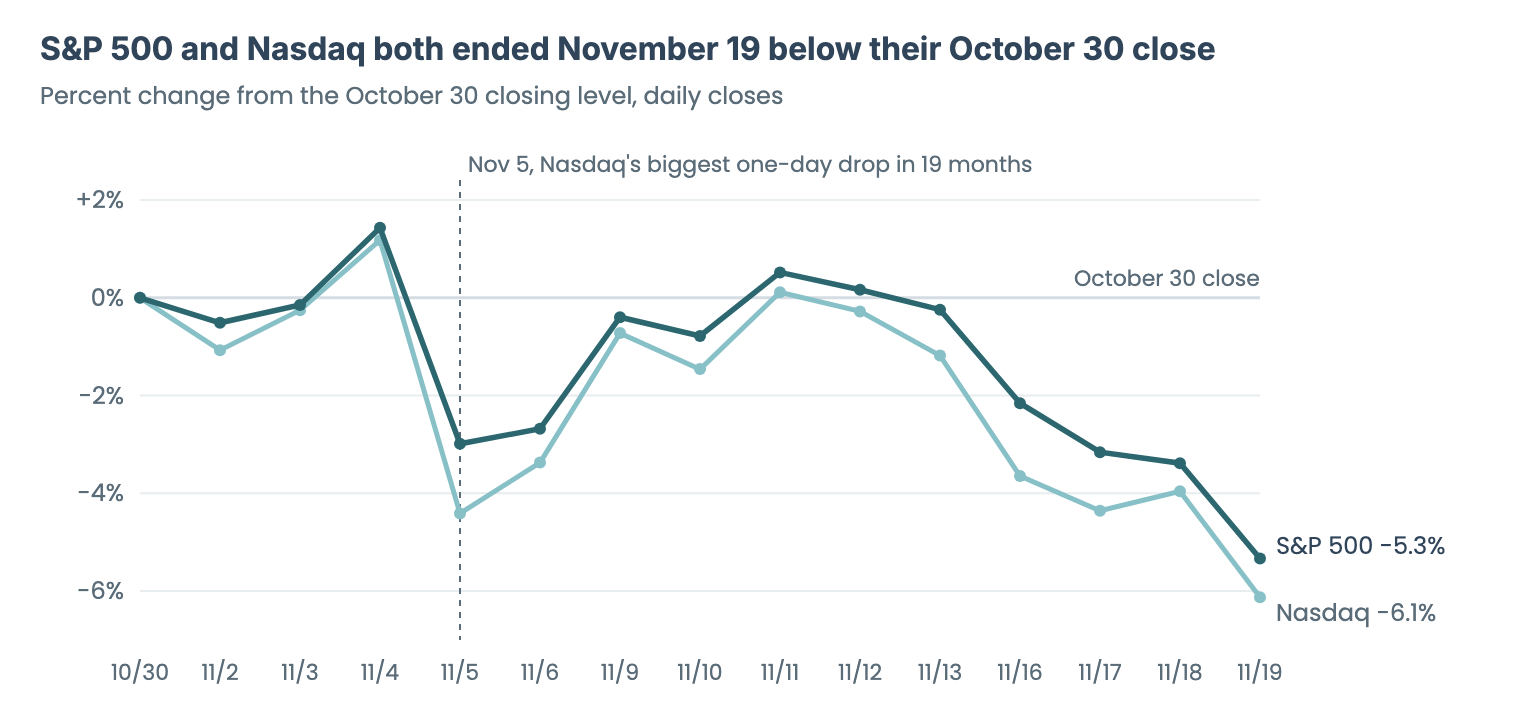
Yahoo Finance daily closing levels, October 30 to November 19, 2026; percent changes are Virtus calculations. Index figures, not investment results. Full sources at the end.
Both indexes fell sharply on November 5 and won back most of that loss over the next few days. The S&P 500 then gave all of it back and more in a six-day slide through November 19.
The S&P 500 index tracks 500 leading US companies. The chart below shows its total return, including dividends, for each calendar year from 1976 through 2025, next to 2026 so far.
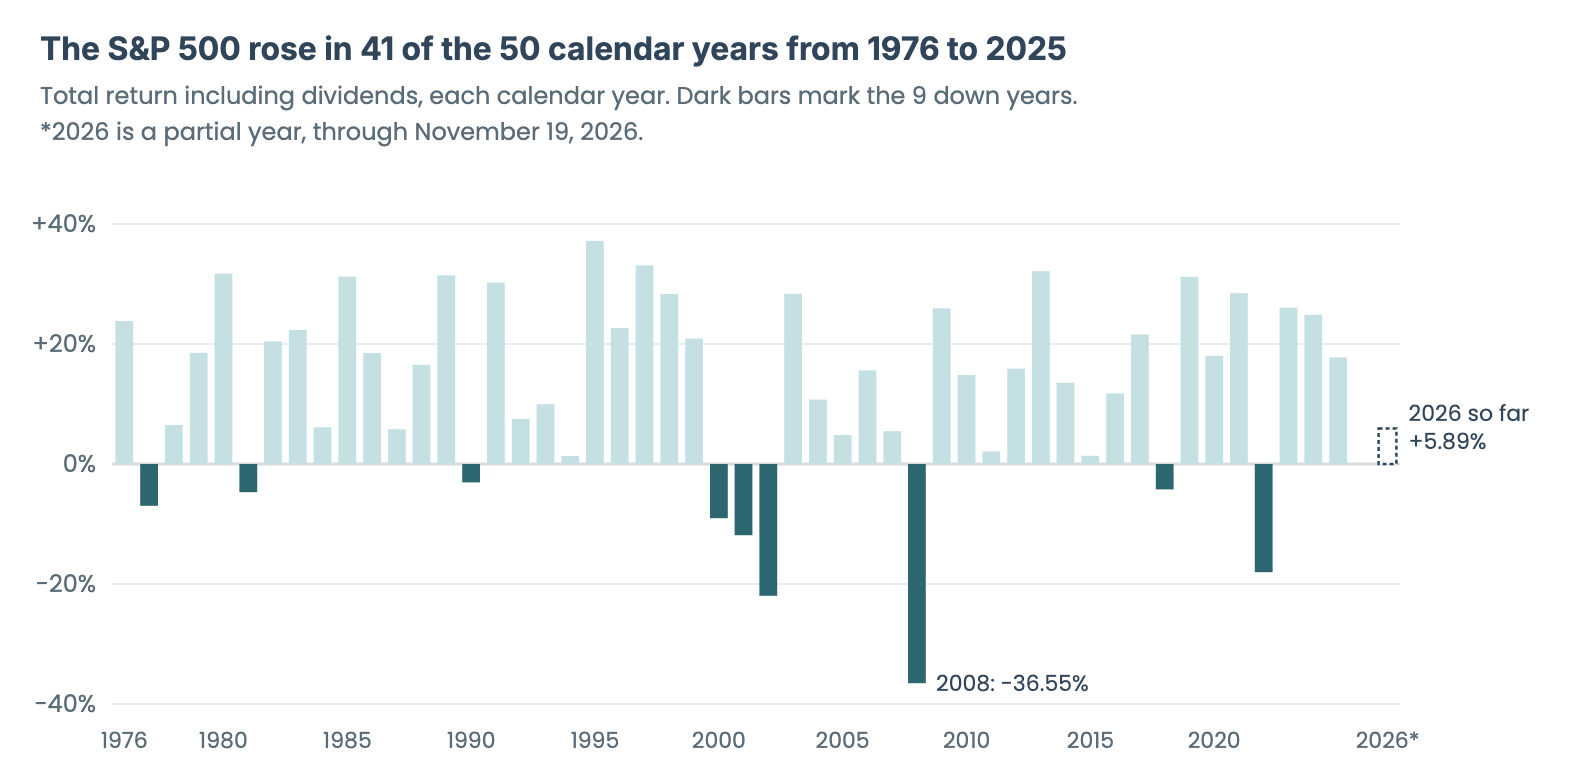
Aswath Damodaran, NYU Stern, S&P 500 total returns including dividends, 1976 to 2025; 2026 through November 19 from the Yahoo Finance S&P 500 Total Return index (^SP500TR), a Virtus calculation. Index figures, not investment results. Full sources at the end.
Over those 50 years, the index rose in 41 years and fell in 9, including a drop of 36.55% in 2008. Through November 19, its 2026 return is +5.89%.
If November's slide kept going and the S&P 500 finished 2026 down, that would make 10 down years out of 51.
A down year is painful to see when you look at the value of your investments.
For us, investing is a long-term process. It is built around the rate of return your financial plan assumes for your mix of investments.
To see why, it helps to know how your plan is built.
Every plan starts with you. You lay out your vision and your goals, like retiring, owning a practice, college for your kids or a second home.
We attach a dollar figure to as many of those goals as we can. Then we look at the time horizon, meaning how many years until each goal arrives.
From there, we back into the numbers. Before retirement, the plan works out how much you need to save. After retirement, it works out how much you can spend. Both rest on an assumed rate of return.
Before you retire, two numbers do most of the work. One is your savings rate, the share of your household's gross income you save each year. The other is the rate of return your plan assumes while you are working and adding money.
Your savings rate is the number you control. It counts your 401(k) deferrals, IRA and taxable account contributions, and cash set aside for goals. The easiest way to keep it steady is to automate it, so the money is saved before it reaches checking.
Say you are 38. You max out your 401(k) and your IRAs every year while you pay down student loans.
While you are working, your plan might assume a return of about 7% a year.* That rate is after advisory fees and fund expenses and before inflation. A key part of planning is that your money has to grow faster than inflation, so you don't lose future purchasing power.
After you retire, it might assume about 5%,* a lower rate, because most people take less risk once they start drawing on their savings. The same basis applies, and your money still needs to outpace inflation to protect your purchasing power. *The 7% and 5% rates are hypothetical planning assumptions, not actual client results or a promise or guarantee of any return. Actual results will vary. See About this example below.
We revisit these rates with you over time and update the plan when they no longer fit.
At 38, you have your income and an emergency fund, say six months of expenses in a high-yield savings account. That cash is the moat around your castle. If something comes up, the cash is on hand, and you aren't forced to sell your long-term investments, like your IRA or 401(k), after a drop like this one.
The right amount of cash depends on your situation. If you own a practice, you need reserves for the practice's operating expenses as well as your personal expenses. If you are an associate, your number is different.
For some reason, most people struggle to let that much cash sit in a high-yield savings account. But whether it is $300,000 for a practice owner or $60,000 for an associate, that is your sleep-well-at-night money. It can cover most things that come up in life that insurance doesn't cover.
With a longer time horizon, the ups and downs shouldn't affect you as much, as long as you can tolerate them, including drops that are deep or last a while. That is why we don't want a plan to be too conservative while you are working. Assume too low a rate of return on your investments, and the plan asks you to save more than you may need. Assume too high a rate of return on your investments, and you could come up short.
Over many years you also have room to adjust. If returns run ahead of the plan's rate for a long stretch, you may be able to retire sooner or save less. If they run behind it, you may need to save more or work longer.
Once you retire, the paychecks stop and your plan starts paying you. Your savings rate drops out, and two different numbers take over.
One is your spending, meaning how much you take out each year. The other is the rate of return your plan assumes while you draw on it.
When you are taking money out, selling after a big drop locks in the loss. That is why money for the next few years of spending usually sits in steadier investments, and why spending can flex for a year or two after a bad stretch. These steps reduce the risk but do not remove it.
Short-term results can land far above or below the long-term rate. If your account ran well ahead of the plan's rate during the run-up in AI stocks, a down stretch can give some of that back.
Expect drops at some point, as they are part of long-term investing. Nobody can say when, or whether, a particular decline will be recovered.
The allocations we build usually spread your money across the United States and around the world, not only the S&P 500.
If your own investments are concentrated, say in sector ETFs that track technology or AI, you may be seeing bigger ups and downs this month. Concentration tends to make the swings larger in both directions.
In most cases, our advice on days like this is to stay the course, keep doing your day-to-day and keep your savings on autopilot.
If you are retired, follow the spending plan you have, including any trims it calls for. Whether this fits you depends on your goals and comfort with risk, so if either has changed, bring it up with your advisor, and we'll walk you through it.
Your plan is built for the long run, and a few steps help keep it on track.
In my experience, many clients would rather not think about assumed rates of return, savings rates or spending rates. They want to know if they're going to be OK and if they can live the life they want.
We don't have a magic wand. Everyone has access to the same investments and the same tools. What you pay for is a plan built around your life and an advisor who keeps it current, including through months like this one.
A lot of the families I work with are juggling a career or a practice, young kids and a long list of goals.
On a day like this one, they don't need to check how far the Nasdaq fell. They know their contributions go in every payday. They know this is a long game.
Barring the end of capitalism and a world where the only assets that matter are canned goods and gold bars, a bad month in the market is part of what your plan was built to expect.
In most cases, Virtus recommends against changing your investments because of a single day or month. Your plan's assumed rates are built to span decades, and short-term drops are part of owning investments.
Your investment mix is built on two things. The first is your risk profile, meaning how big a drop you can sit through without wanting to sell. The second is your goals. Money for a goal that is decades away, like retirement, can usually hold more stocks. Money you need in a few years, like a home down payment, usually sits in steadier investments. That split between stocks and steadier investments is your asset allocation, which I cover in more detail in Understanding Asset Allocation.
A drop like this month's doesn't change your goals or how much risk you can live with, so it usually isn't a reason to change your mix.
If your goals, timeline or comfort with risk have changed, that is a good reason to revisit your investment mix with your advisor.
The assumed rate is a planning assumption, not a guarantee. Actual returns will be higher in some years and lower in others, and investing involves risk of loss, including loss of principal.
The assumption gives the plan a reasonable long-term rate to work from, and we revisit it with you as your situation changes.
The years just before retirement are when your plan starts getting ready for withdrawals. Part of your mix usually shifts toward steadier investments, starting with the money you expect to spend in your first few years of retirement.
If a drop lands close to your retirement date, your plan helps you weigh the options, like keeping the date, working a little longer or trimming spending in your first years. We walk through those choices with you, so the decision isn't made on one bad month.
Your plan prepares for it, though it cannot remove the risk. Money for the next few years of spending usually sits in steadier investments, so you aren't forced to sell stocks while they are down.
If a drop runs long, trimming flexible spending for a while means you sell less at low prices. We review your spending and your mix with you at least once a year, and we may review sooner if a bad stretch lasts.
Your savings rate is the share of your household's gross income that goes toward your future. That includes 401(k) deferrals, IRA and taxable account contributions, and cash set aside for a goal like a home.
To find yours, add up what you saved over the past year and divide it by your household's gross income.
For Current Virtus Clients:
If questions on your personal situation outside of your annual review, please reach out to your Advisor directly.
For Non-Clients with Questions on Your Personal Situation:
Use the link below to reach out to us and an Advisor will contact you to schedule a complimentary consultation.
*7% and 5% are hypothetical long-term planning assumptions, after advisory fees and fund expenses and before inflation, used for illustration. They are not actual client results or a promise or guarantee of any return. The age-38 example and the cash amounts are also hypothetical, not actual clients. Actual results will vary. Past performance is not indicative of future returns. Investing involves risk of loss, and a drop can be large or last a long time. The November percentage changes are Virtus calculations from daily closing index levels. Index figures do not reflect fees or expenses, and you cannot invest directly in an index. The S&P 500 calendar-year and 2026 figures are total returns including dividends, from Aswath Damodaran's data at NYU Stern for 1976 to 2025 and from the Yahoo Finance S&P 500 Total Return index (^SP500TR), a Virtus calculation, for 2026; up and down years are Virtus counts.
Virtus Financial Partners is an investment advisor registered with the U.S. Securities and Exchange Commission; registration does not imply a certain level of skill or training. This content is for educational purposes only and does not constitute personalized investment advice, and Virtus does not provide legal or tax advice. Virtus receives compensation for the advisory services it provides. Certain Virtus representatives are also licensed insurance agents who may offer insurance products in a separate, non-advisory capacity for commissions, which presents a conflict of interest. Past performance is not indicative of future returns. Information is current as of the date published and is subject to change. You should consult your own attorney, CPA, and financial advisor regarding your specific situation.